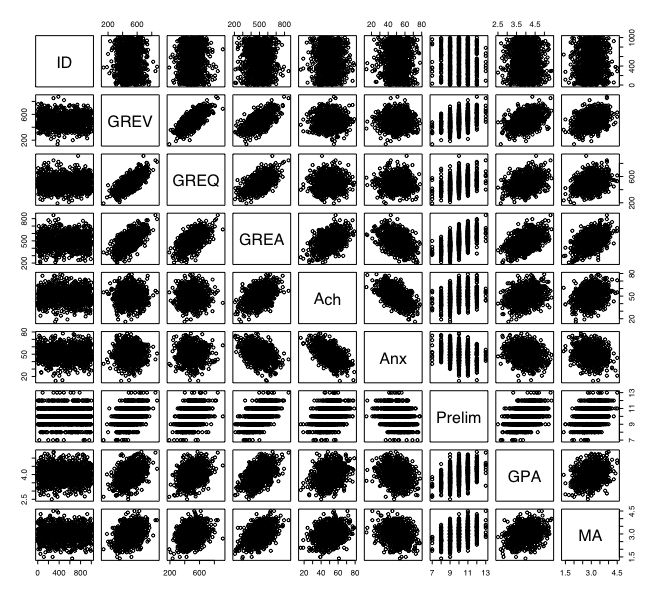
pairs(dataset)
produces this output
 datafilename="http://personality-project.org/R/datasets/psychometrics.prob2.txt"
 dataset =read.table(datafilename,header=TRUE)  #read the data file
Get the data set and find the basic descriptive statistics. Then plot GREV versus GREQ against each other.
Find the correlation matrix of all of the variables in the data set.
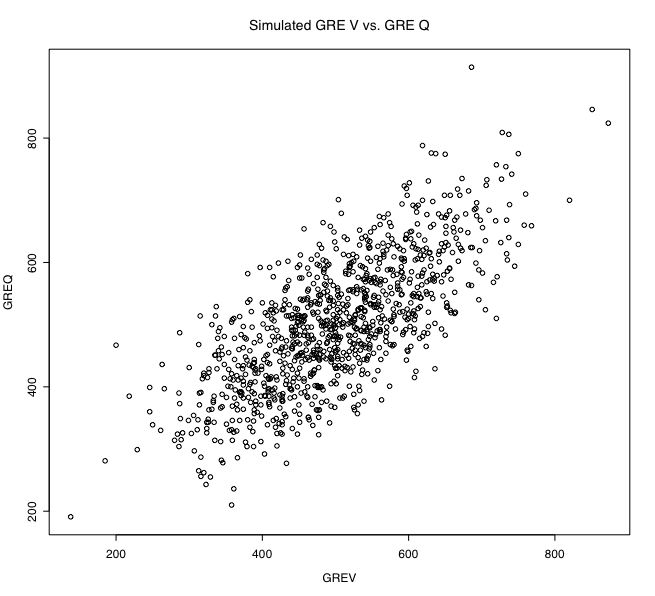
Show the scatter plot of two variables.
summary(dataset)


       ID              GREV            GREQ            GREA
 Min.   :   1.0   Min.   :138.0   Min.   :191.0   Min.   :207.0
 1st Qu.: 250.8   1st Qu.:427.0   1st Qu.:428.0   1st Qu.:431.8
 Median : 500.5   Median :497.5   Median :498.0   Median :495.0
 Mean   : 500.5   Mean   :499.8   Mean   :500.5   Mean   :498.1
 3rd Qu.: 750.2   3rd Qu.:570.2   3rd Qu.:571.0   3rd Qu.:569.0
 Max.   :1000.0   Max.   :873.0   Max.   :914.0   Max.   :848.0
      Ach             Anx            Prelim           GPA
 Min.   :16.00   Min.   :14.00   Min.   : 7.00   Min.   :2.500
 1st Qu.:43.00   1st Qu.:44.00   1st Qu.: 9.00   1st Qu.:3.640
 Median :50.00   Median :50.00   Median :10.00   Median :4.020
 Mean   :49.93   Mean   :50.32   Mean   :10.03   Mean   :4.003
 3rd Qu.:56.00   3rd Qu.:57.00   3rd Qu.:11.00   3rd Qu.:4.360
 Max.   :79.00   Max.   :78.00   Max.   :13.00   Max.   :5.380
       MA
 Min.   :1.400
 1st Qu.:2.700
 Median :3.000
 Mean   :2.996
 3rd Qu.:3.300
 Max.   :4.500
Problem 2: Find the correlation matrix for these cases.
Although the basic command cor(dataset) will do what we want, a more useful call is to round these results to two decimals.
round(cor(dataset),2)
produces this output.
> round(cor(dataset),2)
          ID  GREV GREQ  GREA   Ach   Anx Prelim   GPA    MA
ID      1.00 -0.01 0.00 -0.01  0.00 -0.01   0.02  0.00 -0.01
GREV   -0.01  1.00 0.73  0.64  0.01  0.01   0.43  0.42  0.32
GREQ    0.00  0.73 1.00  0.60  0.01  0.01   0.38  0.37  0.29
GREA   -0.01  0.64 0.60  1.00  0.45 -0.39   0.57  0.52  0.45
Ach     0.00  0.01 0.01  0.45  1.00 -0.56   0.30  0.28  0.26
Anx    -0.01  0.01 0.01 -0.39 -0.56  1.00  -0.23 -0.22 -0.22
Prelim  0.02  0.43 0.38  0.57  0.30 -0.23   1.00  0.42  0.36
GPA     0.00  0.42 0.37  0.52  0.28 -0.22   0.42  1.00  0.31
MA     -0.01  0.32 0.29  0.45  0.26 -0.22   0.36  0.31  1.00
To show the scatter plot of the GREV and GREQ, use the plot() function.
Perhaps more useful is to do this for all the pairs of variables. This may be done as a SPLOM (scatter plot matrix) using the pairs() command.
pairs(dataset)
produces this output
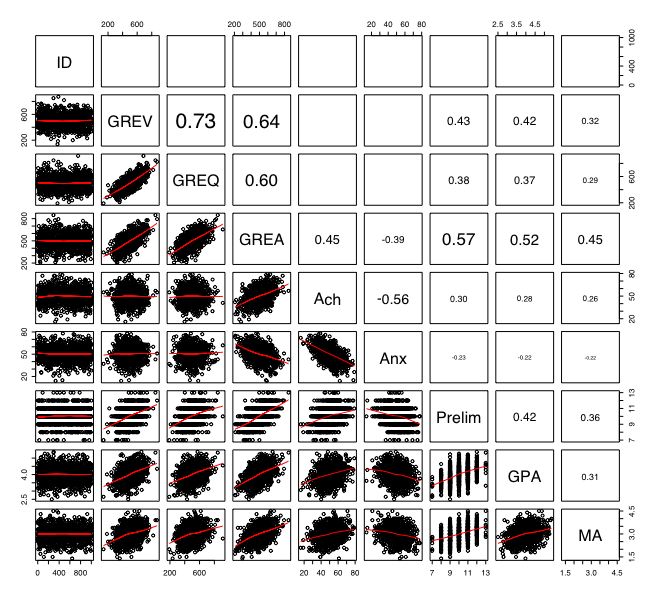
Using a bit more code, it is possible to combine the correlation matrix with the SPLOM
#first, we create a new function (taken from the example for pairs)

panel.cor <- function(x, y, digits=2, prefix="", cex.cor)
     {
         usr <- par("usr"); on.exit(par(usr))
         par(usr = c(0, 1, 0, 1))
         r = (cor(x, y,use="pairwise"))
         txt <- format(c(r, 0.123456789), digits=digits)[1]
         txt <- paste(prefix, txt, sep="")
         if(missing(cex.cor)) cex <- 0.8/strwidth(txt)
         text(0.5, 0.5, txt, cex = cex * abs(r))
     }

 # now use the function for the data. (see figure)
 #do the following one at at time

  pairs(dataset, lower.panel=panel.smooth, upper.panel=panel.cor)